Your

data,
data,
made
made
clear.

One clear view of your business. Connect your data, simplify reporting, and give every team the confidence to act.

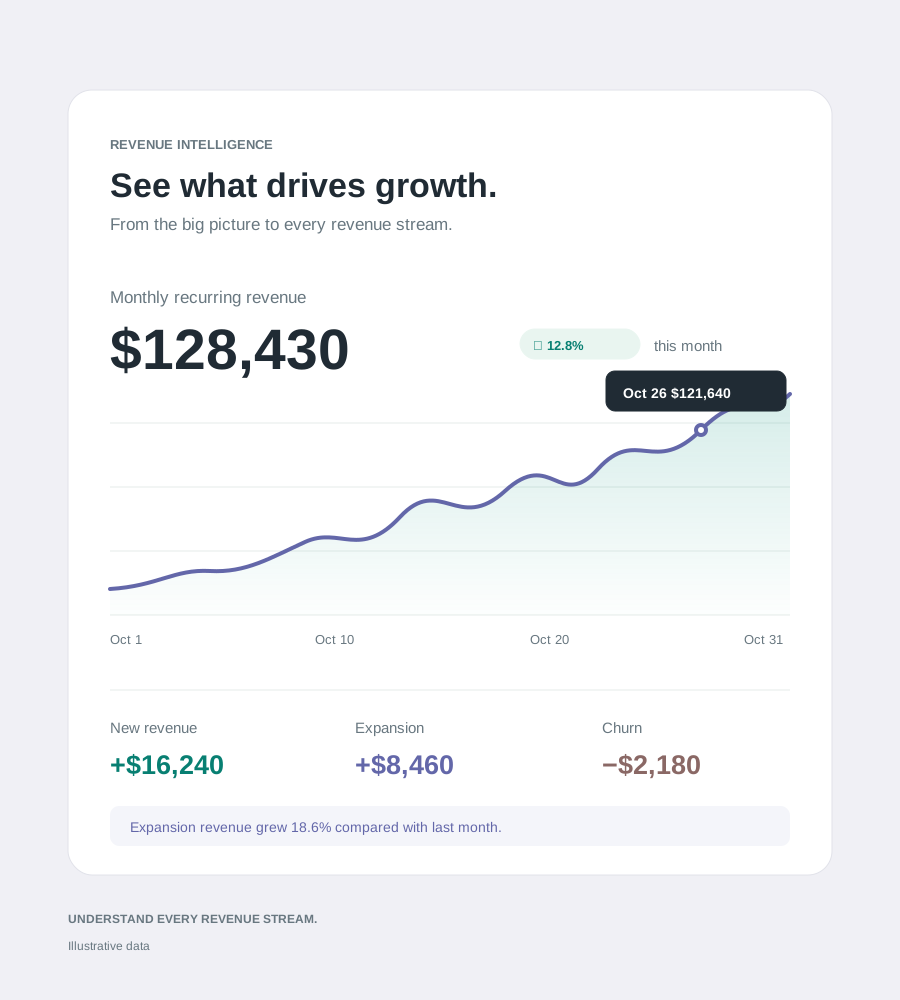
Illustrative CloudScale operational dashboard with sample reporting data
About Us

CloudScale turns scattered business data into decisions your team can act on.

A clearer view of your business

Bring reporting, operations, and customer information together. Start with the questions that matter, agree on the right measures, and give each team a view they can use.


One view
From source to decision
Illustrative operations analyst reviewing a daily performance dashboard
Conversion Icon
Reporting
8h → 2h
Target
Conversion Icon
Freshness
Daily
Goal
Connected Data
Reporting Automation
Clear Decisions
Connected Data
Reporting Automation
Clear Decisions
Connected Data
Reporting Automation
Clear Decisions
Less reporting. More insight.
An illustrative logistics scenario
Impact Icon
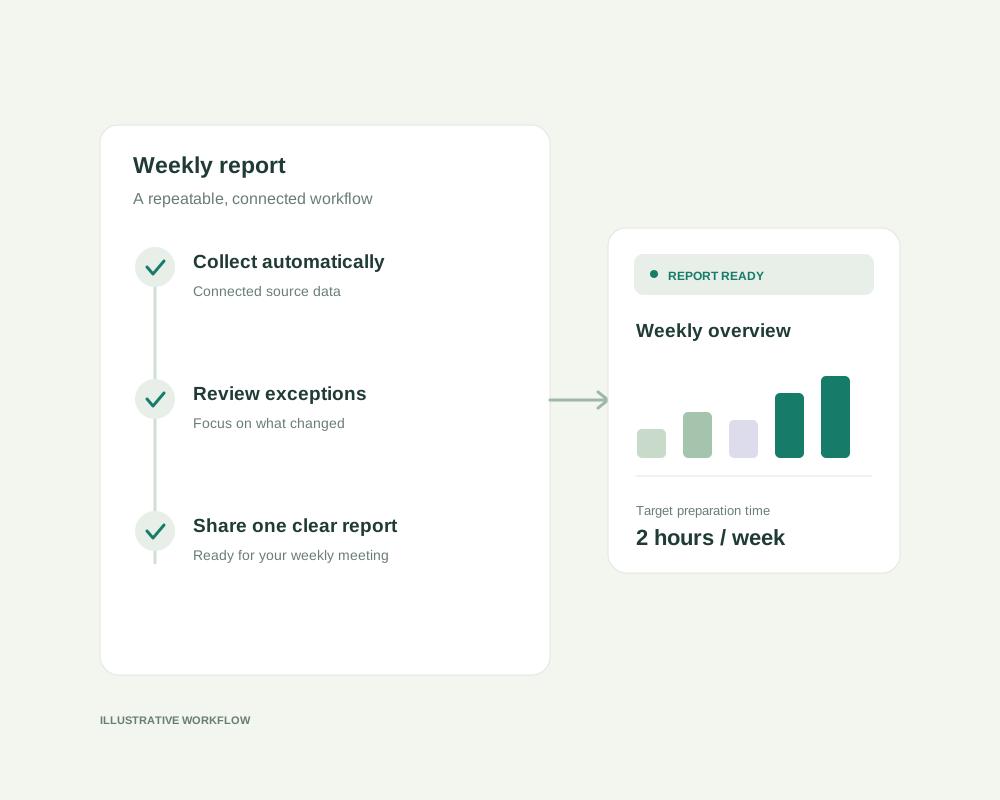
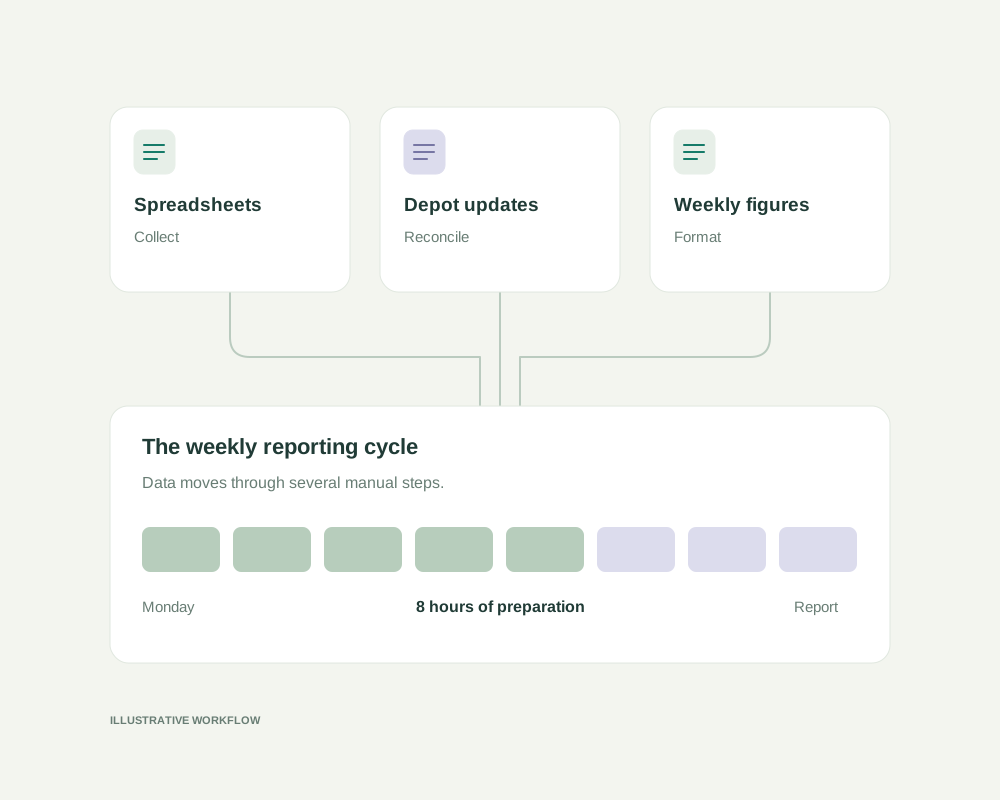
Weekly reporting
8
h
Abstract reporting illustration
Less reporting. More insight.
An illustrative logistics scenario
Impact Icon
Target effort
2
h
Abstract reporting illustration
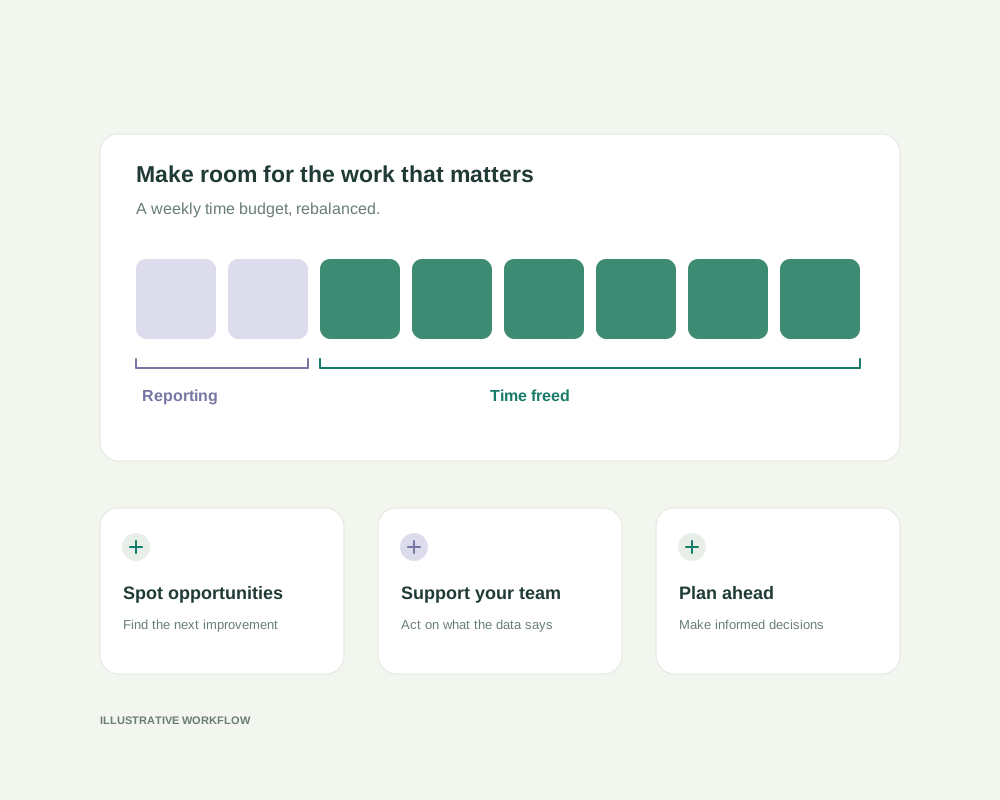
Less reporting. More insight.
An illustrative logistics scenario
Impact Icon
Time returned
6
h
Abstract reporting illustration
Less reporting. More insight.
An illustrative logistics scenario
Impact Icon
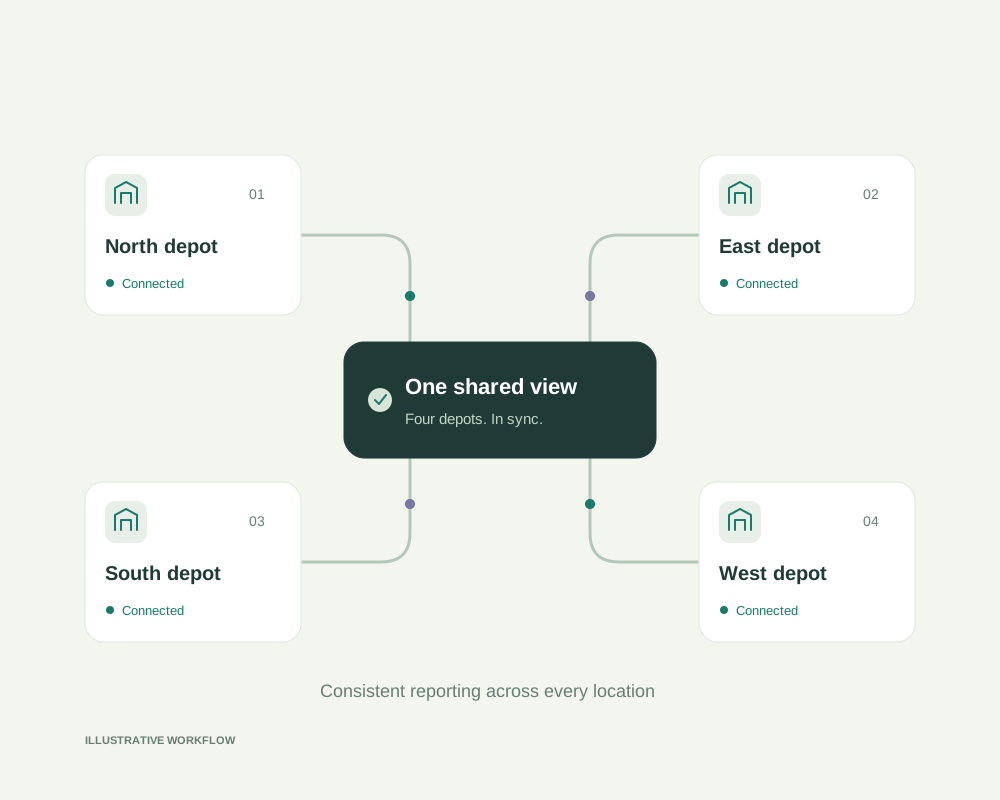
Connected depots
4
Abstract reporting illustration
Impact Arrow Impact Arrow
The Platform

Make better decisions with a shared view.

Service CTG Icon
Connect
Service CTG Icon
Understand
Service CTG Icon
Act
Connected Reporting
Less copying. More clarity.

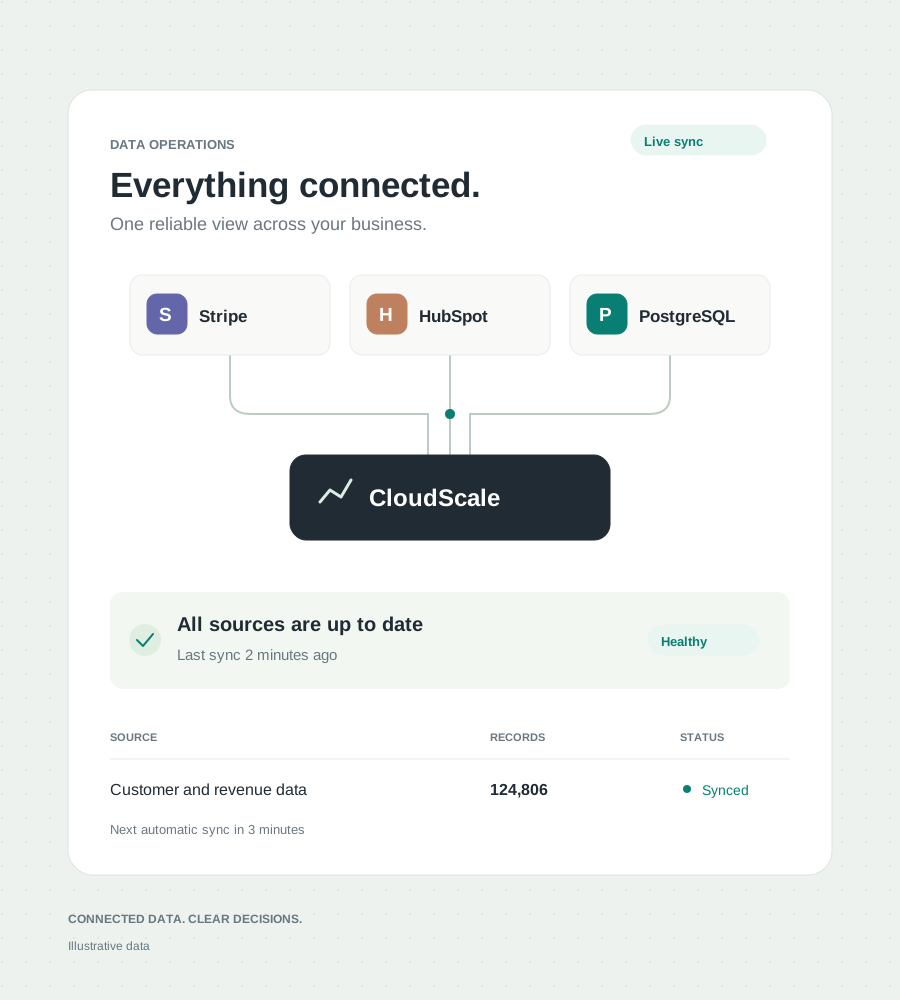
Bring the information behind your recurring reports into one place, with shared definitions for the measures that matter.

Reporting Automation
Timely. Consistent.

Replace repeated spreadsheet preparation with a reliable reporting routine, so the same report does not have to be built twice.

Operational Dashboards
See it. Act on it.

Give managers a daily view of delivery performance, revenue, and exceptions, with enough context to choose the next action.

Customer Intelligence
Adoption. Retention.

Use product adoption and account context to spot where customers need help and where a conversation about growth makes sense.

Our Mission
We connect
your data
to your team
and your next decision.
Your dataSpreadsheets · CRM
Product usage · Billing
CloudScaleConnected sources
Consistent measures
Your next moveDaily performance
Clear follow-up actions
A useful report does more than describe the past.
It helps your team decide what to do next.
Industries

Better visibility for teams that keep business moving.

Industries Icon
Logistics
Industries Icon
Retail
Industries Icon
SaaS
Industries Icon
Services
Industries Icon
...
Illustrative logistics planning workspace
Our Approach

Start with a real business question. Build a clear answer. Make it part of the way your team works.


CloudScale Analytics
From insight to action
CloudScale
Your Data, Connected
SpreadsheetsCRM dataBillingProduct usageWarehouse
Process

A practical path from question to clarity.

Process Icon
Step 01
Understand the question, agree the outcome.

We start with your current reporting routine, the people who use it, and the decisions it should support. Together, we define a measurable first outcome and the information needed to get there.

Process Icon
Step 02
Connect the sources, build a useful view.

We map the reporting sources, agree consistent definitions, and shape a view around your team’s questions. The first version is reviewed with the people who will use it before the scope grows.

Process Icon
Step 03
Put the insight into daily work.

A useful dashboard needs a working routine around it. We agree ownership, review adoption, and turn important changes into clear follow-up actions, so insight leads to a decision rather than another report.

Arrow Icon
Arrow Icon
Explore plans

Flexible plans for every growth stage.

Start with discovery. We agree the data sources, users, and reporting scope before preparing a proposal. Pricing is tailored to your requirements.

Core
Custom
per scope

For a focused reporting need and a clear first outcome.

What’s included:
Pricing List Icon
Shared business measures
Pricing List Icon
Priority reporting sources
Pricing List Icon
Focused dashboard scope
Pricing List Icon
Agreed reporting routine
Growth
Custom
per scope

For teams connecting more data and more decisions.

What’s included:
Pricing List Icon
Cross-team reporting
Pricing List Icon
Recurring report automation
Pricing List Icon
Operational dashboards
Pricing List Icon
Guided rollout planning
Scale
Custom
per scope

For broader visibility across teams and locations.

What’s included:
Pricing List Icon
Account and usage insights
Pricing List Icon
Exception visibility
Pricing List Icon
Team-specific views
Pricing List Icon
Adoption review planning
Enterprise
Custom
per scope

For company-wide reporting and a tailored rollout.

What’s included:
Pricing List Icon
Company-wide scope
Pricing List Icon
Data integration planning
Pricing List Icon
Custom reporting requirements
Pricing List Icon
Agreed support process
Launch
Custom
per scope

A clear first outcome for a growing business.

What’s included:
Pricing List Icon
Reporting discovery
Pricing List Icon
Priority source mapping
Pricing List Icon
First dashboard scope
Pricing List Icon
Success measures
Growth
Custom
per scope

Connected reporting across your core teams.

What’s included:
Pricing List Icon
Shared reporting model
Pricing List Icon
Cross-team dashboards
Pricing List Icon
Reporting automation
Pricing List Icon
Adoption planning
Scale
Custom
per scope

Consistent visibility across multiple locations.

What’s included:
Pricing List Icon
Location-level reporting
Pricing List Icon
Common metric definitions
Pricing List Icon
Exception tracking
Pricing List Icon
Phased rollout
Enterprise
Custom
per scope

A tailored programme for complex reporting needs.

What’s included:
Pricing List Icon
Company-wide discovery
Pricing List Icon
Integration architecture
Pricing List Icon
Custom reporting scope
Pricing List Icon
Agreed support process
Use Cases

See what better data makes possible.
Illustrative business reporting view
01
Bring four depots into one daily performance view. Explore how to reduce weekly reporting from eight hours to two, while helping managers see delivery exceptions sooner.
Operations teams
Illustrative scenario · Logistics
CloudScale Analytics
Illustrative business reporting view
02
Bring pipeline and account information into a shared view. Help sales leaders understand progress, ownership, and the next action without chasing separate spreadsheets.
Revenue teams
Illustrative scenario · B2B sales
CloudScale Analytics
Illustrative business reporting view
03
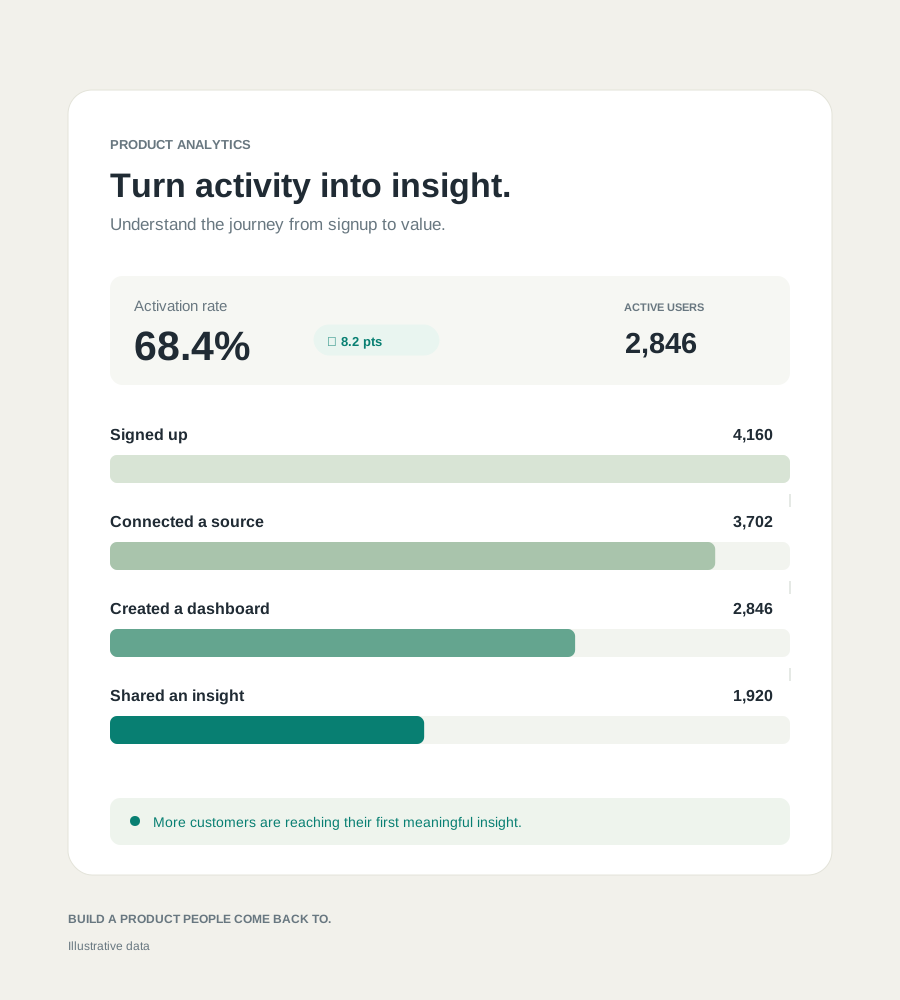
Connect subscription context with product adoption. When usage grows, give the account owner a clear signal to review the customer’s needs before recommending more capacity.
Customer success teams
Illustrative scenario · SaaS
CloudScale Analytics
FAQs

Frequently Asked Questions

Tell us what you are trying to improve. We will start with your business questions.

Do I need a technical team?
Faq IconFaq Icon

You do not need to arrive with a finished technical plan. Bring a recurring reporting problem, an example of the current report, and the people who use it. We will identify the data and technical input needed during discovery.

What happens after I contact you?
Faq IconFaq Icon

Your request reaches our sales team with the details you provide. A team member reviews it and follows up to understand your priorities, agree a discovery conversation, and discuss a suitable next step.

How is data access handled?
Faq IconFaq Icon

We agree the required sources, access permissions, and handling of business data before implementation. Access should be limited to what the agreed work needs; security requirements are part of discovery.

Can different teams use different views?
Faq IconFaq Icon

The starting point is the decision each team needs to make. We agree which measures should be shared and which views need a different level of detail for managers, sales, or customer success.

How is pricing agreed?
Faq IconFaq Icon

A proposal follows discovery. Scope depends on reporting sources, users, complexity, and rollout needs. The plan cards describe possible scopes; they are not a checkout or a fixed-price commitment.

Can we start with one reporting problem?
Faq IconFaq Icon

Yes. A focused reporting problem is often the clearest starting point. We can agree a measurable first outcome, review whether the result is useful, and discuss a broader rollout from there.

Get Started
Ready
to see
your business
more clearly?

Tell us where reporting slows your team down. We will help you define a useful first step.